Market Regime Detection
Watstreet

How can I make a bunch of money? I ask myself that question sometimes, and at Watstreet, I worked on a team that tried to make that problem a little bit easier.
A good way to make money is to trade in the stock market, but there are good and bad times (for the average investor) to be trading in a market. It is thus helpful to have a way to know what the market regime is at any point in time — a classification that categorizes the market state based on trend, volatility, and history.
In our project, we defined 6 market states, though not everyone agrees on this:
Steady bull
Steady growth, small swings
Volatile bull
Upward trend, large swings
Accumulation
Sideways movement, forming a base
Transition
Weakening or changing trend
Correction
Pullback from recent highs
Crisis
Sharp sell-off, high uncertainty
Before we could begin classifying the market, we needed to label training data on these states.
Defining the labels
Market regimes don't come with an agreed-upon ground truth. Before training the LSTM, we had to label our own data, and we tried a few different ways: rules based on trend and volatility indicators, hidden Markov models, K-means clustering, etc.
Comparing the outputs of these methods showed us where different definitions of a regime disagreed, but we found a large overlap between different methods of labelling. This allowed us to semi-automate the labelling of our data where different methods agreed, but of course still required manual effort to fix places where the models disagreed or hallucinated together. For this, we conducted targeted market research on market sentiment, price trends, volatility, and the economic events surrounding those periods.
The labels also had a stability problem. If an indicator sits right at a threshold, a tiny move can flip the label even though the market has barely changed. To handle this, we added buffer bands and required several days of confirmation before switching to a new regime (after all, a market regime shouldn't be lasting only a few days).
Below, we show regime labels for the 2020 COVID crash.

What 71% accuracy was hiding
Once the labels were done, I began working on a stacked LSTM-based system to make some cash. An LSTM felt like a natural fit here since market regimes depend on how conditions evolve over time. By design, an LSTM's memory gates can retain longer-term trends while incorporating recent changes in volatility and momentum.
I used 2 stacked layers with a 60-day lookback window (to give market context), and split the data chronologically into 70% train, 15% validation, and 15% test. My first attempt achieved 71% accuracy, but its macro F1 was only 0.374.
The problem became obvious once I looked at the confusion matrix. The model only predicted regimes 2 and 4. Two other regimes had zero recall, and the test period had no examples of regimes 0 or 1 at all. That is, one recent holdout period couldn't tell me how the model behaves across all six environments.

Furthermore, the training data was badly skewed. Of the 3,517 training windows, about 58% were steady bull or accumulation. Correction and crisis had just 6% each. The test period looked very different, with correction making up 47.5% of it, and steady bull and accumulation absent. The problem was both class imbalance and a shift in the mix of regimes over time. Class-weighted loss was already in use, but weighting rare classes could not give the model more distinct examples of them.
Testing across different markets
To combat this, I switched to walk-forward training and evaluation. You train on an earlier period, test on a later one, then expand the training history and repeat. A large struggle here was getting good train / test windows that balanced the class weights without leaking data. This took a lot of data work and experimenting to find optimal thresholds.
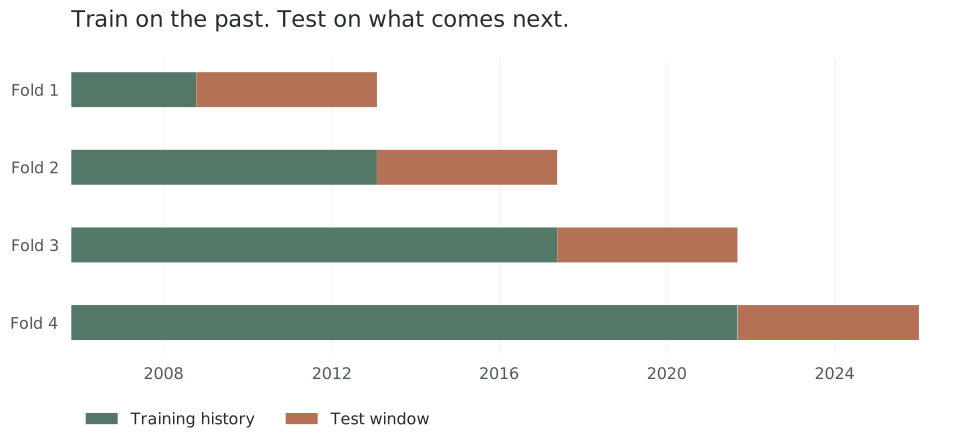
The first run got 62.5% accuracy and 0.577 macro F1. Accuracy went down, but that exposed weaknesses the original split had been hiding.
Making the experiments systematic
The training pipeline used class-weighted loss to account for the uneven class frequencies. I experimented with different parameters, model sizes, and training methods. I then conducted hyperparameter tuning on lookback length, hidden layer sizes, learning rate, and dropout, allowing the model to become stronger.
However, at this point, the model was still failing on the most important regime: crisis. The precision was 88.9%, but recall was only 23.9%. So when the model called a crisis, it was usually right, but it still missed most crisis days.
It was time to make a product decision on how I wanted this model to predict. Consider the average trader. Is it better for a model to misclassify a bullish regime or a bearish regime? If the model misclassifies a bull as a bear, the trader chooses not to put money in and thus misses out on profit. However, if a bear (in particular, a crisis) is misclassified, the trader loses a significant portion of their bankroll. So, it is better for the model to be more conservative with its predictions to minimize the probability of large losses.
To implement this, one easy way was to tune the threshold required to accept each regime. Up to this point, I simply chose the predicted regime to be the one with the highest probability, but since the model is wary to predict crisis but is usually right when it does, it makes sense to lower the threshold required for it to choose crisis.
With some more efforts on this front, the macro F1 reached 0.67 and crisis recall jumped to 74%.

A better metric
At this point, our model was pretty good for our purposes. It had strong accuracy and recall on all regimes, and particularly excelled at crisis regimes. However, consider the following:
Suppose a crisis starts on day k. The model can fail to forecast that transition using information available on day k − 1, but after seeing prices sharply drop on day k, it can start predicting crisis for subsequent days. The model can thus get high crisis precision and recall while missing the warning that mattered most.
This made next-day regime transitions a useful target: using information available today, could the model predict that a new regime would begin tomorrow? I evaluated how many actual transitions it forecast one day ahead. For certain traders and applications, this is far more important than correctly predicting days within an established regime.
The base model was decent at this, but I had to make some changes to make it even better. I added a second prediction head to specifically predict whether the next day would mark a new regime. Further, I upped the weighting of transition examples in the training, and altered the loss function to prioritize this new metric using an asymmetric buffer weighted on the risk of the regime.
The model improved! At the end, the model correctly forecast 72% of crisis transitions one day ahead, while maintaining strong precision and recall overall with macro F1 of approximately 0.79. These new efforts made the newest model better at the old metric than the base model! Most of the earlier daily errors were clustered around regime boundaries. By emphasizing transitions, the second head likely pushed the model to learn features that sharpen those boundaries, which helped both tasks.

Reflections
My biggest takeaway from this project is to always look at what a number leaves out. Many times in this project, I saw a high number and got excited, only to realize later there was a subtle dynamic at play which made that number less impressive and less useful. It's important to look at all metrics and be creative and thorough with how you evaluate any systems, because the things you don't look at are where the weaknesses always end up lying.